Ten million orders. 2.1 million users.
The interesting number is the one between them.
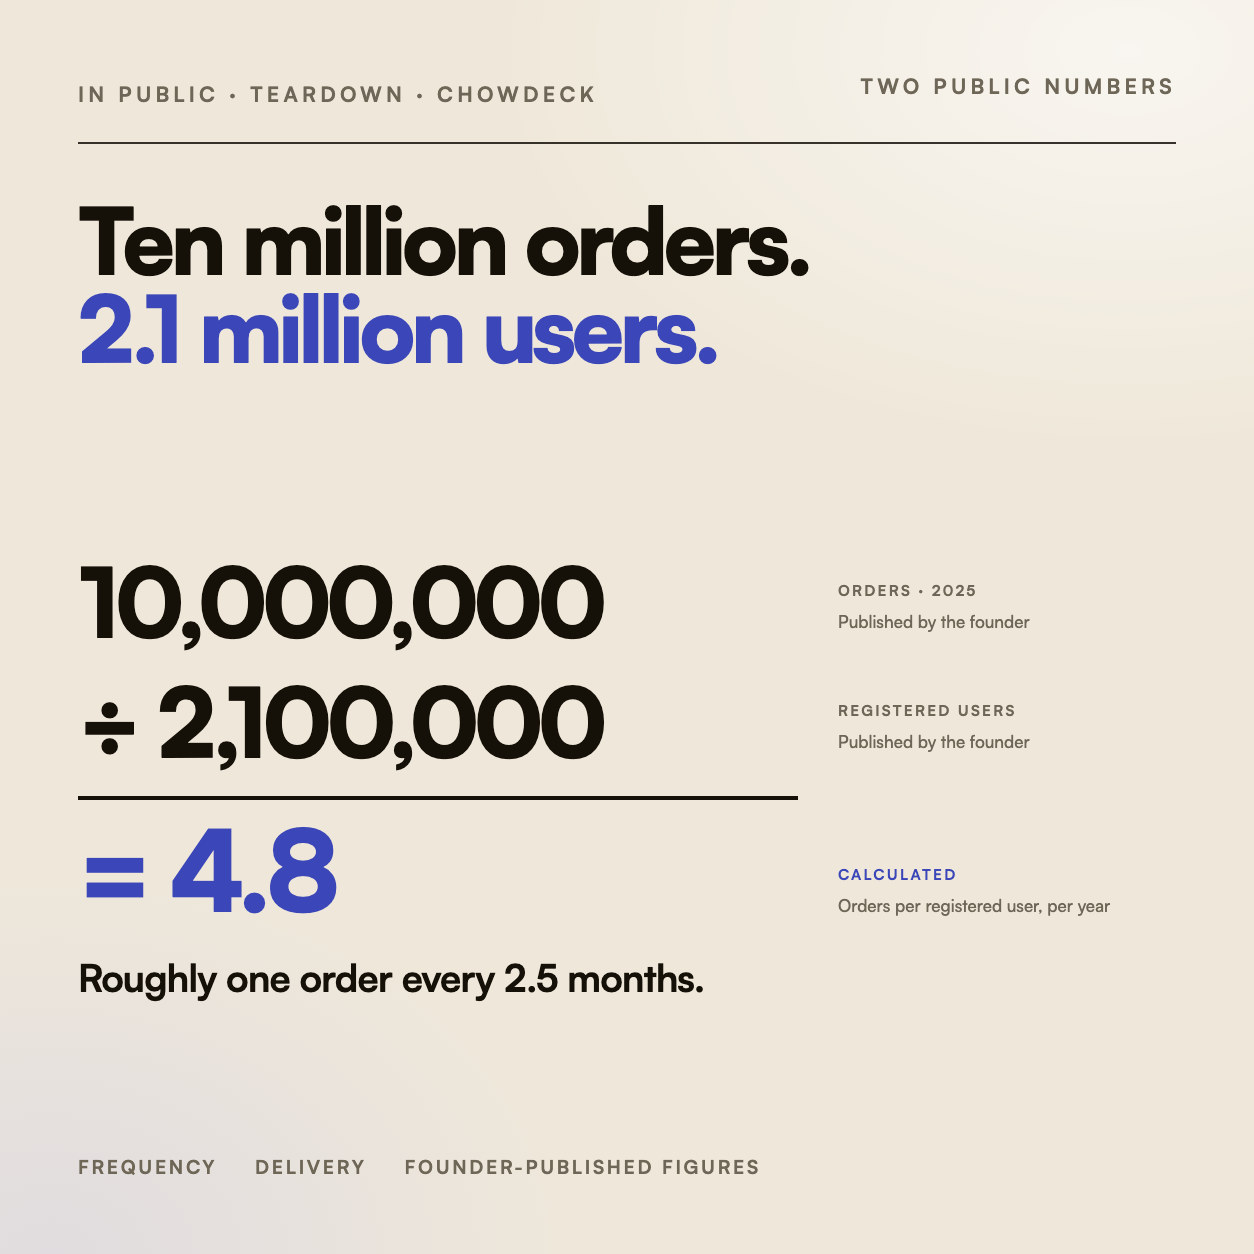
Femi Aluko published Chowdeck’s 2025 figures himself: ten million orders delivered, to 2.1 million registered users.
It’s a genuine milestone. It’s also the kind of number that closes a conversation rather than opening one.
SourcePublished by Chowdeck’s founder.
One number into the other.
Ten million orders divided by 2.1 million registered users equals 4.8 orders per registered user per year, or roughly one order every 2.5 months.
The interesting question isn’t the headline order count. It’s how often the average registered user comes back.
Where frequency usually goes.
My lifecycle lens, not findings about Chowdeck. This is where I’ve seen frequency go across food and commerce platforms.
A good first experience, and then the app stops existing.
The same two or three restaurants, and nothing beyond them.
Someone stops ordering and nothing in the system notices.
EstimateMy lifecycle lens, from other food and commerce accounts — not a finding about Chowdeck.
Two numbers, published by the company itself. The rest is division.